This study demonstrates anomaly detection, not an accusation against Örebro kommun. The model helped me choose a record to investigate. The documents explained a billing error that had already been corrected. A flag is a reason to look closer, not proof of wrongdoing.
I searched andfound gold.
— An anomaly detection study
My model scanned 2.4 million public invoices from Örebro kommun for unusual patterns. One of the most unusual cases involved a million-kronor order from a goldsmith. I requested the original documents and found 169 watches, diamond rings and 18‑carat gold chains bought for staff, along with a billing error.
I ran anomaly detection on public invoices. Here is what my algorithm found…
Data from
Örebro kommun, a municipality in Sweden, publishes a list of the supplier invoices it has paid.
Updated every month, the data shows who was paid, how much, on which date and by which municipal department. It is free for anyone to use, but it does not say what was bought.
In Sweden, anyone can request documents from a public authority without giving their name or explaining why. I used that right to obtain the three documents behind this story.
Source: Örebro kommun, supplier invoices, open data (24 Excel files, 7,294,483 postings). Amounts excluding VAT; the dollar figure is rounded from 38.9 billion kronor. Data downloaded 9 Sep 2026 from 38.9 billion kronor. Data downloaded 9 Sep 2026.
the scanScanning fiscal year 2023 invoicesScanning transactions for fiscal year 2023
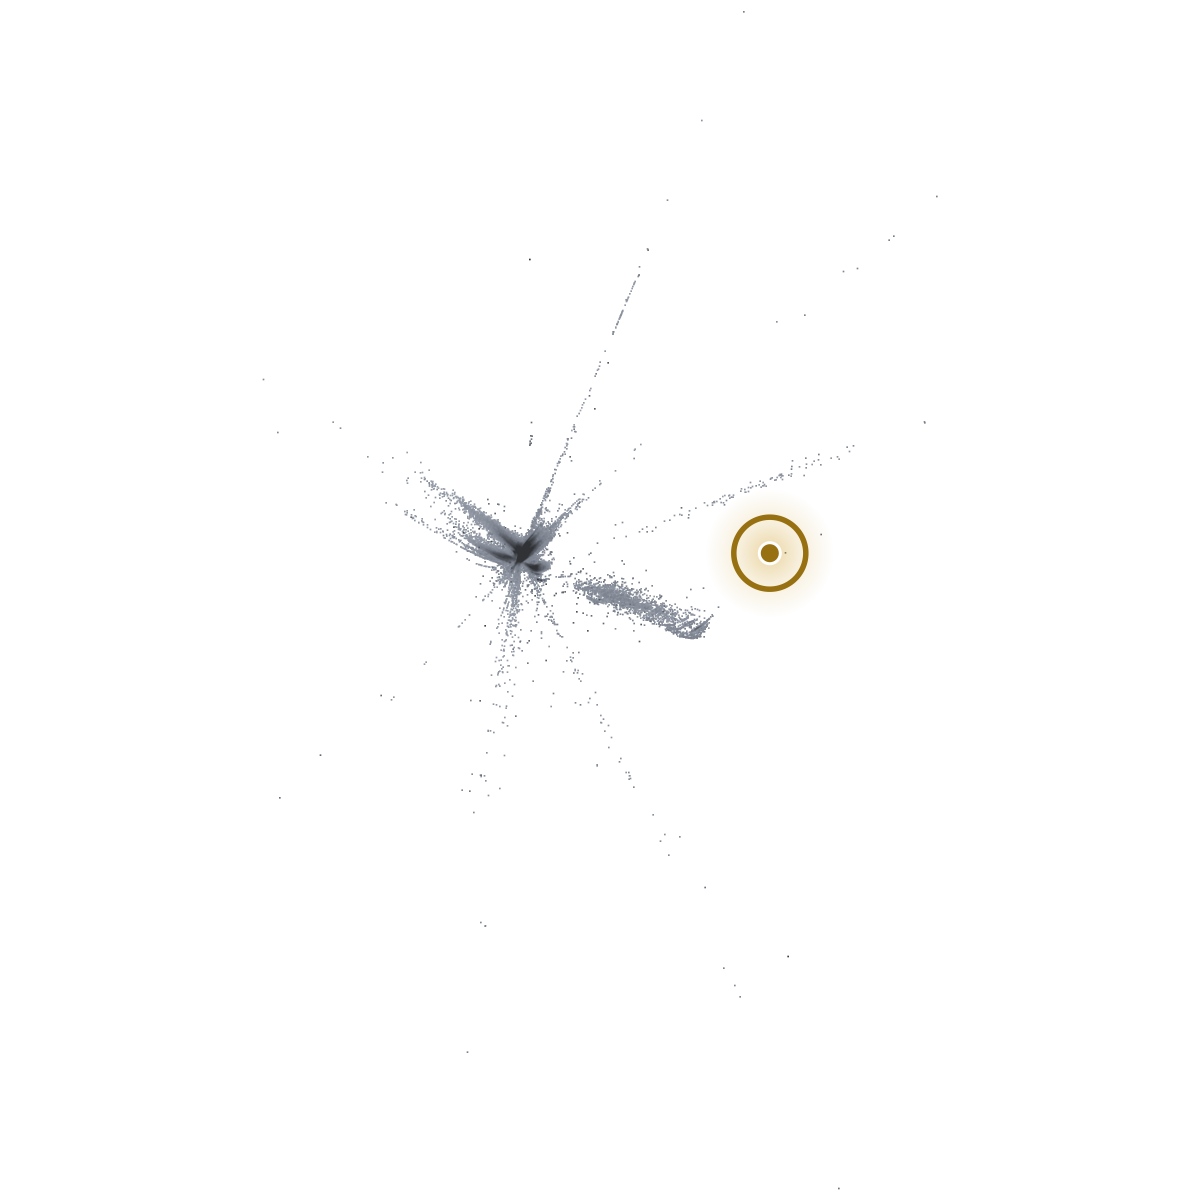
I trained an autoencoder on the fiscal year of 2023. It learns what a normal invoice looks like, then highlights invoices that deviate from the normal. Across several settings and training runs, one case from 2023 was particularly eye‑catching.
The autoencoder’s map of all 291,292 invoices paid in fiscal year 2023. Similar invoices lie close to each other; darker dots deviate more from the normal. Gold: the credit note from the gold store, ranked 5th.
investigation
Following the outlier
I traced the credit note through the payment records and found three documents for the same order.
The three documents of the order, by fiscal year of payment. Amounts in kronor, excluding VAT.
Fiscal year
Document
Number
Dated
Paid
Amount (SEK)
2023
Invoice 24849251Ranked 37,652nd of 291,292Ranked 37,652nd of 291,292
24849251
Dated 15 Nov 2023
Paid 15 Dec 2023
882,960
2023
Credit note 24862111Flagged by the scan · ranked 5th of 291,292
24862111
Dated 30 Nov 2023
Paid 15 Dec 2023
−882,960
2024
New invoice 24867828
24867828
Dated 1 Dec 2023
Paid 2 Jan 2024
1,014,000≈ 1 million131,040 kr more than the first bill
131,040 kr more than the first bill
Three documents, one order. The credit note, in gold, is the document the scan flagged: it cancels the first invoice in full, and the new invoice takes its place. The scan ranked the first invoice 37,652nd: it flagged the correction, not the bill. The scan ranked the first invoice 37,652nd: it flagged the correction, not the bill. In the open data the store has 13 invoices from 2018 to 2025, and this is its only credit note.
Source: Örebro kommun, supplier invoices, open data (payment dates, amounts excl. VAT excl. VAT); dates of issue from the three documents, received from Örebro kommun on 30 Sep 2026. Fiscal year = calendar year of payment.
So I emailed them about it
I asked for the three documents, why the first invoice was credited, and whether the gifts were for 2023 or 2024. The registrar sent all three and answered both.
MJ
Majd Jamalto Örebro kommun
Copies of three supplier invoices
Hi!
My name is Majd Jamal and I’m analysing the municipality’s open data on supplier invoices. Thank you for publishing it!
I would like copies of three invoices from Jarl Sandin Guld och Silver AB (org. no. 556285-0700), account 71110 Staff recognition and gifts. Invoice numbers according to the open data:
If possible, I would also like to know why the first invoice was credited, and whether the gifts were for 2023 or 2024.
Thanks in advance!
Kind regards Majd Jamal
3 days later
ÖK
Örebro kommun· Registratorto Majd Jamal
Re: Copies of three supplier invoices
Hi!
Attached are the requested documents. The first invoice concerned the 24-year gifts for 2023, and it was credited because the invoice had the wrong amount on two lines.
Kind regards, Registrar Information Management and City Archives, Örebro kommun
24849251.pdf
24862111.pdf (the credit note the model flagged)
24867828.pdf
Source: emails between Majd Jamal and Örebro kommun, 27 and 30 September 2026, translated from Swedish. Email addresses are left out.
inside documents
What was inside the invoice?
The documents show what was bought, how the billing changed and when the replacement invoice was paid.
1
What
169 gifts for employees with long service
Everything on the new bill: 1,014,000 kr excl. VAT. One dot is one gift; the 42 gold chains are in gold.
42 gold chains, 18 carat
38 watches
34 rings
29 designer jewellery sets
19 diamond pendants19 diamond pendants
6 pairs of diamond earrings6 pairs of diamond earrings
1 diamond bracelet1 diamond bracelet
2
When
Billed in 2023, paid in 2024
The original invoice and its full credit share the same payment date, 15 December 2023, and net to zero. The replacement invoice was paid on 2 January 2024.
202320241 Dec 202310 Jan 202415 Dec2 JanInvoice paid +882,960Credit note paid −882,960= 0 krNew invoice paid1,014,000 kr
Did this correctionmove the expenseout of 2023?
3
Why the amount changed
The same order, a higher bill
The original invoice listed the 42 gold chains at 2,880 kr each. The replacement listed them at 6,000 kr each, adding 131,040 kr excluding VAT. The municipality said the original amounts were wrong.
20232024202320241 Dec 202315 Dec2 Jan10 Jan 20242,880 kr / chain6,000 kr / chainInvoice paidNew invoice paid
Why did the same chainon the receipt increasein price?
Source: Örebro kommun, supplier invoices, open data (payment dates, amounts excl. VAT); dates of issue, the gifts and their prices from the three documents and the registrar’s reply, received on 30 Sep 2026.
Disclaimer
Disclaimer
This study demonstrates anomaly detection, not an accusation against Örebro kommun. The model helped me choose a record to investigate. The documents explained a billing error that had already been corrected. A flag is a reason to look closer, not proof of wrongdoing.
Method and limitations
From the open data to the map, in six small steps.
The method as a flow: collect the open data, combine and clean it, count the invoices per year, turn each invoice into 8 numbers, squeeze them through an autoencoder to 2 numbers and back, draw the 2 numbers as the map and rank the invoices by highest reconstruction error.
two column layouts → one clean table nothing dropped, credits kept
Invoices per year
= 1,000 invoices
2018277,410
2019287,252
2020274,081
2021264,546
2022288,748
2023291,292
2024298,241
2025292,256
2026173,030
By the year each invoice was first paid. 2026 runs January to July.
Feature engineering
The math
Each line is compared with the other lines of its supplier, committee or account, and each invoice ends up with 8 numbers. −log turns a share into a score: 0 if it always happens, higher the rarer it is.
P(account | supplier)How likely is it that this supplier is booked to this account?
−log(the supplier’s lines on this account divided by all the supplier’s lines)
P(account | committee)How likely is it that this committee books to this account?
−log(the committee’s lines on this account divided by all the committee’s lines)
z(amount | account)How far is this amount from what is usually paid on this account?
log amount − the account’s median, all divided by the account’s spreadan invoice keeps its largest and its smallest score
z(amount | supplier)How far is this amount from what this supplier is usually paid?
log amount − the supplier’s median, all divided by the supplier’s spreadagain its largest and its smallest score
P(sign | account)How likely is a debit, or a credit, on this account?
−log(lines on this account with this sign divided by all lines on this account)
linesHow many lines does the invoice have?
the number of lines on the invoice
log amount = log(1 + |amount|), one scale for 10 kr and 10 million kr. median = the middle value. spread = how far the amounts usually lie from the median. An invoice with several lines keeps its largest score (for the two amounts, its largest and its smallest), and each of the 8 is standardised before the autoencoder sees it.
8 numbers per invoicehow rare · how big · which sign · how many lines
Autoencoder
8 → 2 → 8 · no labels
8 in
rebuilt
latent space
Visualize
the 2 latent numbers of each 2023 invoice, drawn as the map
5
Rank anomalies
by highest reconstruction error top 5 of 291,292 · 2023
1Premises rent290.85
2Flat rent70.05
3Agency nurses32.43
4Vehicle inspection21.75
5Credit note, jeweller18.73
The method as a flow: collect the open data, combine and clean it, count the invoices per year, turn each invoice into 8 numbers, squeeze them through an autoencoder to 2 numbers and back, draw the 2 numbers as the map and rank the invoices by highest reconstruction error.
two layouts → one clean table nothing dropped, credits kept
Invoices per year
= 1,000 invoices
’18
’19
’20
’21
’22
’23
’24
’25
’26
By the year first paid. 2026: January to July.
Feature engineering
The math
Each line is compared with the other lines of its supplier, committee or account, and each invoice ends up with 8 numbers. −log turns a share into a score: 0 if it always happens, higher the rarer it is.
P(account | supplier)How likely is it that this supplier is booked to this account?
−log(the supplier’s lines on this account divided by all the supplier’s lines)
P(account | committee)How likely is it that this committee books to this account?
−log(the committee’s lines on this account divided by all the committee’s lines)
z(amount | account)How far is this amount from what is usually paid on this account?
log amount − the account’s median, all divided by the account’s spreadan invoice keeps its largest and its smallest score
z(amount | supplier)How far is this amount from what this supplier is usually paid?
log amount − the supplier’s median, all divided by the supplier’s spreadagain its largest and its smallest score
P(sign | account)How likely is a debit, or a credit, on this account?
−log(lines on this account with this sign divided by all lines on this account)
linesHow many lines does the invoice have?
the number of lines on the invoice
log amount = log(1 + |amount|), one scale for 10 kr and 10 million kr. median = the middle value. spread = how far the amounts usually lie from the median. An invoice with several lines keeps its largest score (for the two amounts, its largest and its smallest), and each of the 8 is standardised before the autoencoder sees it.
8 numbersper invoice
Autoencoder
8 → 2 → 8 · no labels
8 in
rebuilt
latent space
Visualize
each 2023 invoice’s 2 numbers as the map
5
Rank anomalies
by highest reconstruction error top 5 · 2023
1Premises rent
2Flat rent
3Agency nurses
4Vehicle inspection
5Credit note
Evaluation of the method.
The model uses reconstruction error to rank unusual invoices, but this does not establish whether they contain mistakes. Without labelled outcomes, I cannot report F1 or ROC AUC. Synthetic tests could check specific behaviours, though optimising for invented cases could favour patterns I already expect.
I reviewed the top 20 invoices from each year and followed up the jeweller’s credit note. The documents explained a billing error that had already been corrected. This shows how a flag can guide investigation. Overall detection performance remains unmeasured.
Receipts.
The open data does not show what was bought. I have to request the original invoices, which slows down investigations. Working with the municipality could make reviews faster and help improve the model.
Each invoice becomes 8 numbers, like P(account | committee). The autoencoder squeezes them into 2, a dot on the map, and rebuilds all 8; the worse the rebuild, the darker the dot.
7,294,483postings in the ledger
cleanone row per invoice
8 featuresnumbers per invoice
X 291,292 × 8every invoice of 2023
8 → 2 → 8the autoencoder; the 2 is the map
P(account | committee): how likely is it that this committee pays for this kind of thing?
“This system is built on unsupervised learning, without any labels, it’s difficult to measure exact performance. And with injected anomalies, it would optimize on something we know we are looking for.”
On evaluation
Data: Örebro kommun’s supplier invoices, January 2018 – July 2026: 7,294,483 postings, 2,446,856 invoices, about $4 billion. Invoice details (CSV) · The emails (TXT)
Appendix
Every formula and setting behind the features, the X and the autoencoder.
Feature engineering
8 per invoice
Each posting line of 2023 is scored against the lines like it. An invoice keeps its lines’ most extreme scores and its number of lines: eight numbers per invoice.
Which account
1 Account given committee
p_konto_namnd_max
High when at least one line on the invoice is booked to an account this committee rarely uses.
High when the invoice is split over many posting lines (in 2023 the median is 1 and the maximum 266).
x_{v,8} = |v| = \#\{\, i : i \in v \,\}
Notation and shared formulas
i
a posting line
v
an invoice, v = 1, \dots, N, and the set of its lines, i \in v
e_i
era: the account plan, identified by code length (5 or 4 digits)
c_i
committee
s_i
supplier (organisation number)
k_i
account code
y_i
amount, kronor excl. VAT
Share and rarity
n(\cdot) counts the 2023 posting lines with those values: g a group (a committee, a supplier, an account, each within its era), u a value inside it. The rarity is 0 when every line in the group has the value, and grows the rarer it is.
\hat{P}(u \mid g) = \frac{n(g,\, u)}{n(g)}
-\ln \hat{P}(u_i \mid g_i)
Log amount
Size on a log scale, sign ignored: the sign is feature 7.
a_i = \ln\!\left(1 + |y_i|\right)
Typical amount
The median log amount in the line’s group g: its account within its era, (e_i, k_i), for features 3 and 4; its supplier, s_i, for 5 and 6.
m_g = \operatorname*{median}_{j \in g} a_j
Robust spread
The median absolute deviation M_g, scaled (×1.4826) to match a normal \sigma; when M_g is 0, the mean absolute deviation A_g, scaled (×1.2533) to match a normal \sigma too; never below 0.05.
One row per invoice, one column per feature. Missing or infinite values are set to 0 first (2023 has none). Each column is then centred on its mean and divided by its standard deviation, so all eight count on the same scale.
A small neural network squeezes each invoice’s eight numbers into two, then rebuilds all eight from those two. Trained on every invoice of 2023, it learns what ordinary invoices look like: an invoice it rebuilds badly is unusual.
The drawing: the invoice’s 8 standardised numbers enter an encoder of 128, 64 and 16 units and come out as z, 2 numbers; a decoder of 16, 64 and 128 units rebuilds 8 numbers from z. One rebuilt number misses its original, marked in gold.
The same form in reverse, with its own weights; the eight outputs are linear.
\hat{\mathbf{x}}_v = D(z_v) \in \mathbb{R}^{8}
D:\; 2 \to 16 \to 64 \to 128 \to 8
Training
The mean of \varepsilon over each batch B, minimised for 20 epochs. The published run trained with AE.train_stream, which shuffles within windows of four batches read in file order; AE.train (used by examples/run_analysis.py) shuffles all invoices each epoch, so its map differs in detail.